Understanding the Capital Efficiency Report
June 10, 2026
Introduction
Wheel traders think about risk in dollars, not just contracts. A $150 profit can be excellent if it used $5,000 of capital for two weeks, but mediocre if it tied up $60,000 for the same period.
The Capital Efficiency report in Options Wheel Trader is built to answer that question: which trades used capital well? It compares open and closed trades using the same capital base, then ranks them by practical efficiency metrics such as dollars per day, return on capital, annualized return, premium yield, and ticker-level performance.
Where to find it
In the app, open Plan and choose Capital Efficiency.
The report is available on the Active and Pro plans. If you are on Starter, you will see an upgrade prompt instead of the full report.
What problem this report solves
Traditional P&L reports tell you what made or lost money. They do not always tell you whether that money was worth the capital required.
Capital Efficiency helps you compare trades across:
- Different strike prices
- Different contract counts
- Different tickers
- Different holding periods
- Open and closed positions
That matters because wheel trades can look similar on premium collected but very different once you normalize by capital and time.
How capital is calculated
For each option trade, the report uses:
capital at risk = strike price * contracts * 100
This keeps puts and calls on the same notional basis. For example:
1 contract at a $50 strike = $5,000 capital at risk
2 contracts at a $125 strike = $25,000 capital at risk
The report skips trades that do not have enough data to calculate a positive capital base or a usable P/L value.
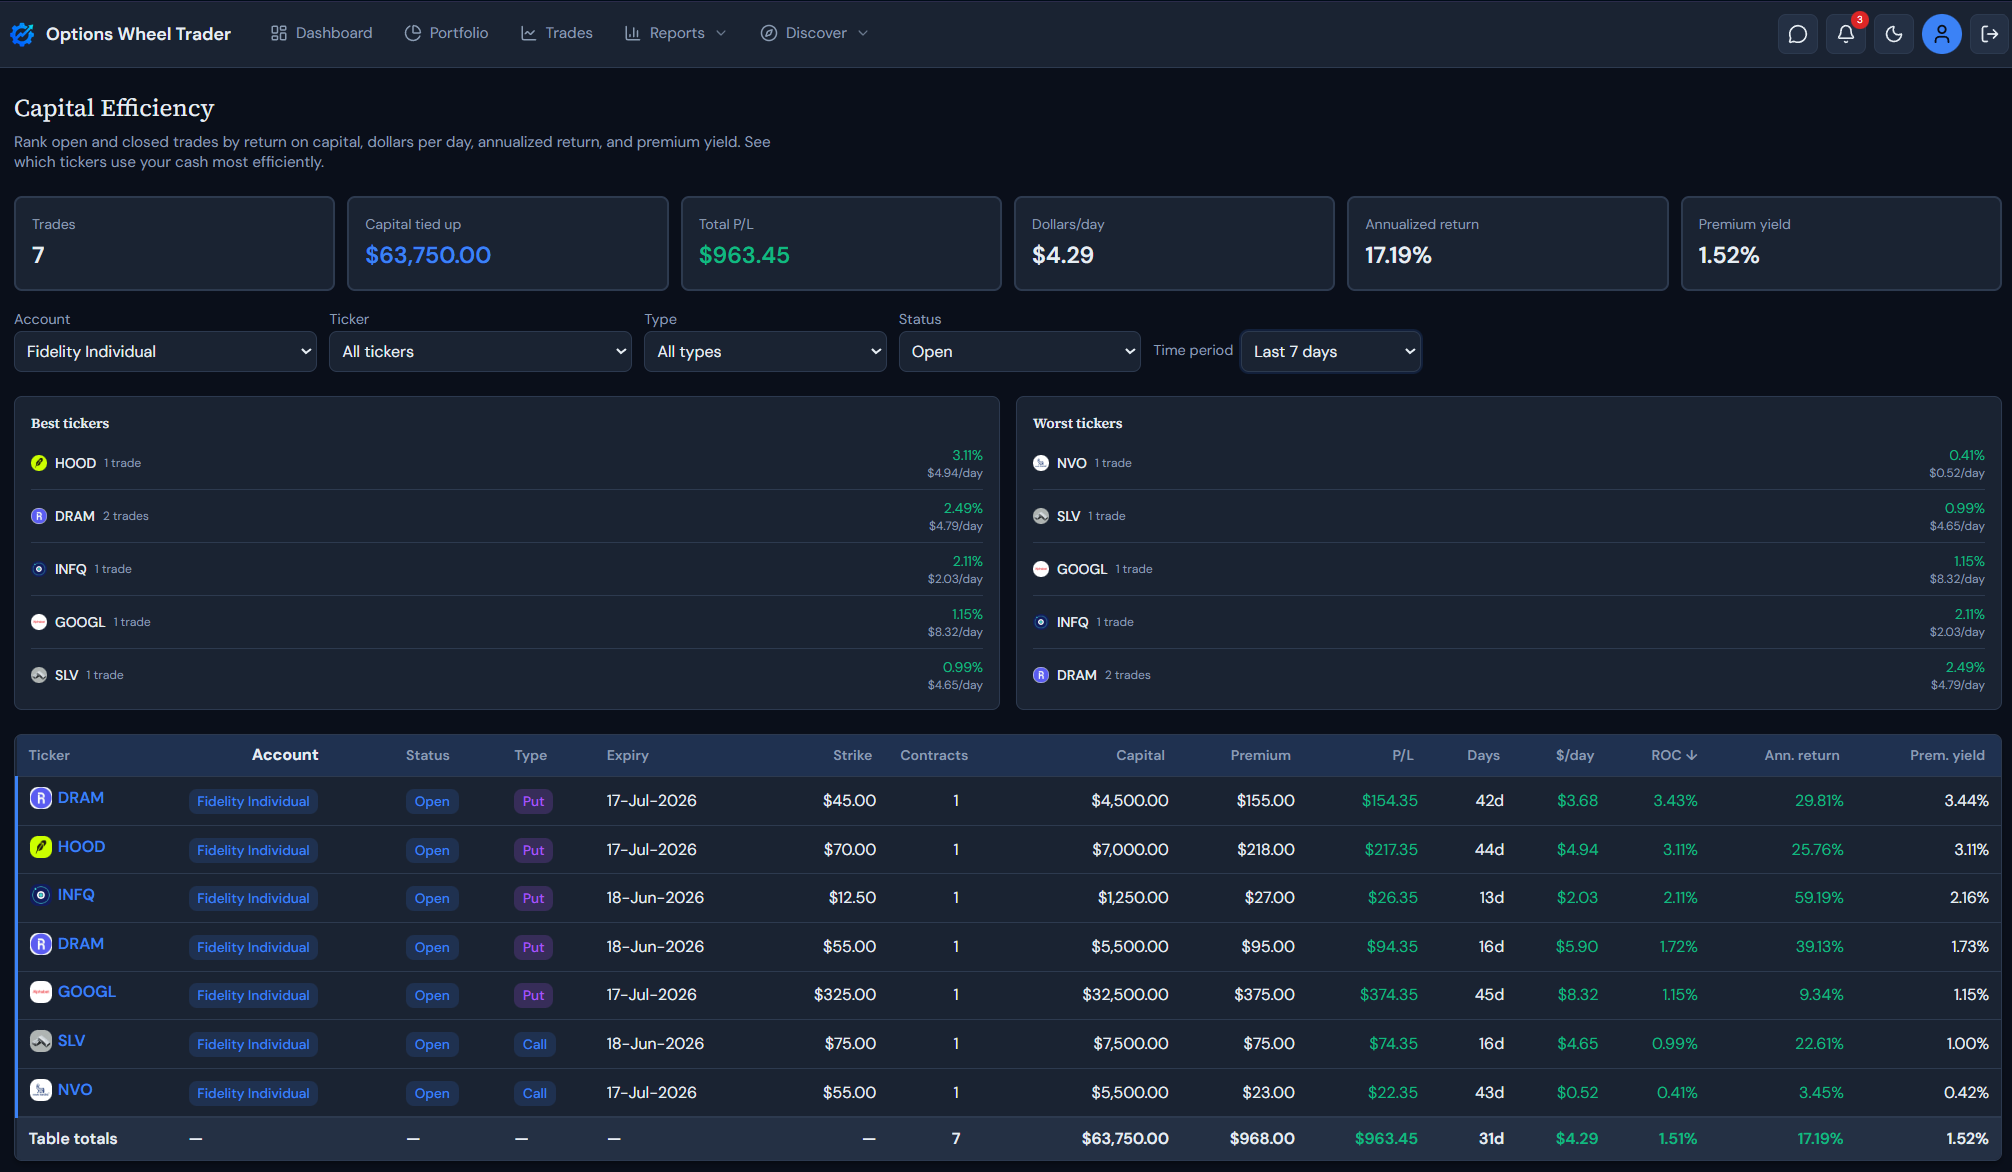
Summary cards at the top
The top cards summarize the currently filtered report:
| Card | What it means |
|---|---|
| Trades | Number of trades included in the current ranking |
| Capital tied up | Total capital at risk across the filtered trades |
| Total P/L | Sum of realized or current P/L across the filtered trades |
| Dollars/day | Average dollars per day across included trades |
| Annualized return | Capital-weighted annualized return |
| Premium yield | Capital-weighted premium collected as a percentage of capital |
These numbers update when you change filters, so you can compare one account, ticker, status, or time period without leaving the page.
Filters
Use the filter row to narrow the report:
- Account: all accounts or one brokerage account
- Ticker: all tickers or one underlying
- Type: puts, calls, or both
- Status: open, closed, expired, assigned, rolled, or all
- Time period: presets or a custom date range
For open trades, the time filter uses the open date. For non-open trades, it uses the close date when available, otherwise the open date.
The ranked trade table
Each row links back to the underlying trade and shows:
- Ticker, account, status, and type
- Expiry and strike
- Contracts
- Capital
- Premium
- P/L
- Days
- Dollars/day
- ROC
- Annualized return
- Premium yield
Click a table header to sort by that column. This is useful when you want to switch from “highest dollars per day” to “most capital tied up” or “best annualized return.”
The table footer totals the currently filtered rows, including contracts, capital, premium, P/L, average days, average dollars per day, weighted ROC, weighted annualized return, and weighted premium yield.
Key metrics explained
Dollars per day
dollars/day = P/L / days
This shows how much each trade produced per day of capital commitment. For closed trades, days means actual days held. For open trades, days means the planned open-to-expiry duration, not just days elapsed so far.
That open-trade rule avoids overstating very new positions. A trade opened yesterday with 30 days to expiry should not look like it is producing a full month of premium in one day.
ROC
ROC = P/L / capital at risk * 100
ROC means return on capital. It answers: “How much did this trade make or lose relative to the capital it required?”
For closed trades, the report uses realized profit_loss. For open trades, it uses current open-trade P/L as recorded by the app.
Annualized return
annualized return = ROC * 365 / days
Annualized return turns the trade’s capital return into a yearly pace. This is helpful for comparing a 7-day trade with a 45-day trade, but it should not be treated as a prediction.
For open trades, the report uses total open-to-expiry duration, which makes the annualized value closer to the planned life of the trade.
Premium yield
premium yield = premium collected / capital at risk * 100
Premium yield measures how much premium the trade collected relative to the capital required. It is different from ROC because it looks at premium collected, not final or current P/L.
Example:
Sell 1 put at a $50 strike
Collect $1.00 premium

Capital at risk = $50 * 1 * 100 = $5,000
Premium collected = $1.00 * 1 * 100 = $100
Premium yield = $100 / $5,000 * 100 = 2%
If you later close that option for $0.25, ROC is based on the net outcome, not the original premium:
P/L = $75
ROC = $75 / $5,000 * 100 = 1.5%
Premium yield tells you how rich the premium was. ROC tells you what the trade actually produced.
Best and worst tickers
The report also aggregates trades by ticker and shows best and worst tickers by capital efficiency.
Use this section to spot patterns such as:
- A ticker that collects strong premium but produces weak P/L after exits
- A ticker that uses a lot of capital but produces low dollars per day
- A smaller-capital ticker that consistently ranks well
- Names where losses are dragging down otherwise good premium yield
The ticker panels are a starting point. Use the table below them to inspect the individual trades behind each pattern.
Suggested workflow
Try this review process:
- Open Plan → Capital Efficiency.
- Start with all accounts and all tickers to see the full ranking.
- Sort by Capital to find where the most cash is tied up.
- Sort by $/day and Ann. return to find trades with the best time-adjusted efficiency.
- Filter to one ticker when the best or worst ticker panel reveals a pattern.
- Click into individual trades to review setup, exit, assignment, or roll decisions.
- Convert repeated findings into rules for future entries.
For example, you may find that one ticker produces good premium yield but poor ROC after rolls, or that shorter-duration trades look attractive until capital-adjusted results are compared.
Important notes
- The report is for analysis and decision support, not trade recommendations.
- Results depend on accurate strike, contract, premium, status, date, and P/L fields.
- Open trades use current open-trade P/L and total open-to-expiry duration.
- Annualized values are comparisons, not promises.
- Premium yield does not account for exit cost by itself. Use it alongside ROC and P/L.
Ready to use Capital Efficiency?
Sign in on an Active or Pro plan and open Plan → Capital Efficiency to see which trades are putting your capital to work best.
Get started with Options Wheel Trader
Legal disclaimer
The Capital Efficiency report and this article are provided for informational and educational purposes only. They do not constitute financial, investment, tax, or legal advice.
Options trading involves substantial risk and is not suitable for all investors. Capital at risk, assignment risk, liquidity, volatility, and execution conditions can produce losses beyond expected premium.
Report outputs use product formulas and your stored trade data. They do not guarantee future performance, trade quality, or profitability.
Always confirm contract details, risk exposure, and account eligibility with your broker before placing any trade.
Past performance is not indicative of future results. Options Wheel Trader is not a broker-dealer, does not execute trades, and does not provide individualized investment advice.
Review our Terms, Privacy Policy, and consult a qualified financial professional as needed.